The Most Uncomfortable Statistic in Finance
Every year, thousands of fund managers show up to work with Ivy League degrees, Bloomberg terminals, and armies of analysts. They charge investors anywhere from 0.75% to 2% annually in management fees. They publish research. They hold quarterly calls. They promise alpha.
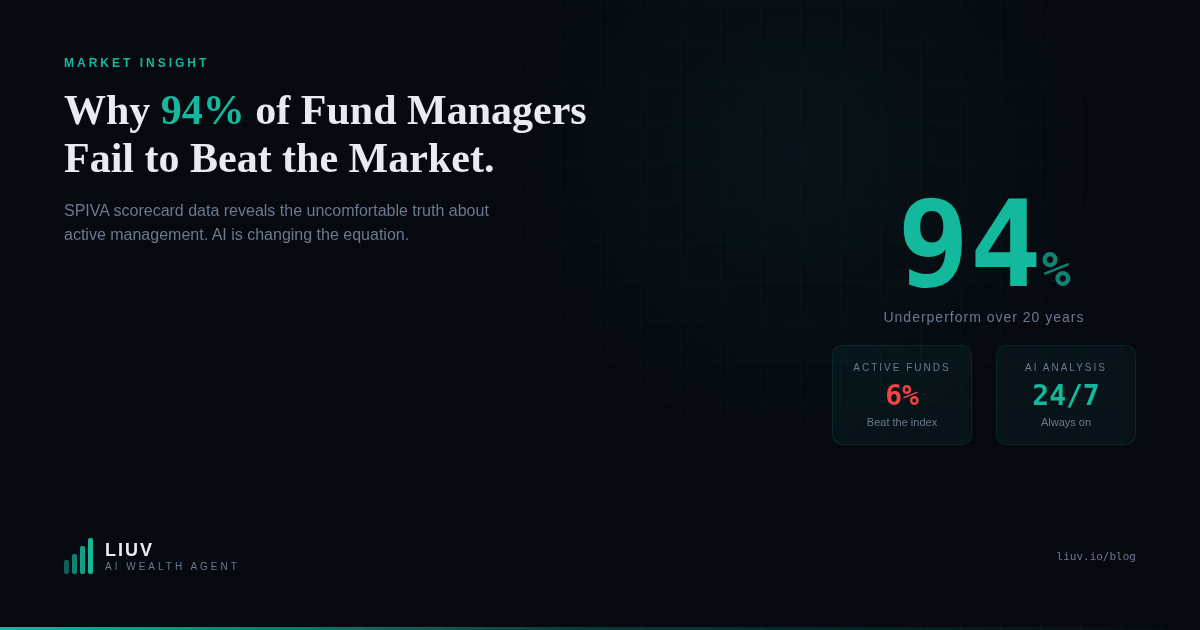
And year after year, the data says the same thing: nearly all of them lose to a simple index fund.
According to the S&P SPIVA U.S. Scorecard — the most comprehensive and longest-running study of active fund performance — over a 20-year period ending in 2024, approximately 94% of actively managed large-cap U.S. equity funds underperformed the S&P 500. Not once. Consistently, decade after decade.
This is not a minor quirk of the data. It is one of the most replicated findings in all of financial economics. And it should permanently change how every investor thinks about what they’re paying for.
What’s Actually Going On
The failure of active management is structural, not incidental. Three forces work against professional managers simultaneously.
- Fee drag compounds against performance before a single stock is chosen. The average actively managed large-cap fund charges 0.75–1.2% per year. On a $500,000 portfolio compounded over 30 years at a gross 9% return, that drag erases roughly $600,000–$900,000 in terminal wealth. This is not an opinion — it is arithmetic. Index funds, by contrast, typically charge 0.03–0.20% annually.
- Behavioral bias degrades decisions under pressure. Behavioral finance research by Daniel Kahneman and Amos Tversky established that humans are systematically irrational investors. We feel losses roughly twice as intensely as equivalent gains. We anchor to irrelevant price levels. We chase recent performance. These biases do not disappear when a person has a CFA designation and manages $2 billion. If anything, career risk and quarterly benchmarking amplify them.
- Scale kills alpha. A fund managing $20 million can exploit genuine inefficiencies in small-cap markets. A fund managing $20 billion cannot — the act of deploying capital at institutional scale moves prices and eliminates the very inefficiencies the manager is trying to capture. Every successful fund eventually becomes a victim of its own success.
The Benchmark Every Investor Must Know
Before analyzing any individual stock or fund, every investor should understand the baseline alternative:
A low-cost, diversified index ETF — tracking the S&P 500, MSCI World, or equivalent — has historically returned approximately 8–10% per year on average over long time horizons.
This is not guaranteed. No return is. But it is the factual historical record, net of minimal fees, with no analysis required. It is the bar that every alternative investment strategy must clear to justify its additional complexity, cost, or risk.
If you are going to own individual stocks, the only rational reason to do so is the reasonable expectation that your process will generate returns above that 8–10% baseline — enough above it to compensate for the additional concentration risk you are accepting.
That is the standard LIUV holds itself to.
The AI Thesis: Structural Advantage, Not Magic
The failure of active management is not a failure of intelligence. It is a failure of architecture. Human analysts are limited by cognitive bandwidth, emotional bias, institutional constraints, and — critically — the inability to process the full scope of information needed to make truly rigorous investment decisions across thousands of companies simultaneously.
Artificial intelligence does not solve every problem in investing. Anyone who tells you otherwise is selling something. But AI does address several specific structural problems:
- Comprehensive, consistent analysis. A human analyst covers 20–30 stocks in depth. LIUV’s Portfolio Advisor Agent applies the same rigorous 10-pillar methodology to thousands of stocks simultaneously, without fatigue or bias.
- Emotion-free processing. No P&L stress. No career risk. No quarter-end anxiety. The process stays identical regardless of market conditions.
- Always-on monitoring. Earnings releases, regulatory filings, and credit events create short-lived pricing dislocations. An AI agent monitoring in real time sees them. A manager checking reports twice a day does not.
- Cross-market fluency. Global investors should have access to global opportunities. LIUV’s Cross-Border Intelligence Agent scans EU, US, Brazilian, and additional markets simultaneously.
LIUV’s 10-Pillar Framework: The Foundation
Every analysis LIUV produces runs through the same 10 rigorous filters:
| Pillar | What It Measures |
|---|---|
| 1. Earnings Stability | Consistent, growing EPS over 10+ years |
| 2. Financial Strength | Current ratio, cash coverage, debt serviceability |
| 3. Revenue Growth | Sustainable top-line expansion |
| 4. Earnings Growth | EPS CAGR benchmarked against cost of capital |
| 5. ROIC | Competitive moat indicator (threshold: >11%) |
| 6. ROE | Capital efficiency vs. sector and history |
| 7. Price-to-Earnings | Valuation vs. historical averages and peers |
| 8. Price-to-Free-Cash-Flow | Business quality beyond accounting earnings |
| 9. Debt-to-Equity | Capital structure and financial risk |
| 10. Shareholder Returns | Dividends, buybacks, and total capital return |
This is the analytical process that Berkshire Hathaway’s team applies to every major investment. The difference is that LIUV runs it across thousands of stocks simultaneously — and presents the output in a format every investor can understand.
A Live Example: Adobe Inc. (ADBE) — 10-Pillar Scorecard
As of March 2026 | Current price: $273 | All data sourced from public filings
| Pillar | Score | TTM | 5-Year Avg |
|---|---|---|---|
| Earnings Stability | 8/10 | EPS $16.70 | $13.42 avg |
| Financial Strength | 7/10 | Current Ratio 1.00; OCF $10.0B | CR 1.11 avg |
| Revenue Growth | 8/10 | 10.5% growth; 93% recurring | 12.8% CAGR |
| Earnings Growth | 9/10 | EPS +35.1% | 18.4% CAGR |
| ROIC | 9/10 | 58.8% — far above 11% threshold | 34.2% avg |
| ROE | 8/10 | 55.4% | 38.7% avg |
| P/E | 8/10 | 16.3x — 60% below historical avg | 40.3x avg |
| P/FCF | 9/10 | 10.8x; FCF $9.85B | 28.5x avg |
| Debt/Equity | 6/10 | 0.57x — rising due to buybacks | 0.42x avg |
| Shareholder Returns | 5/10 | No dividend; ~3.5% buyback yield | — |
| Overall | 7.7/10 |
ROIC of 58.8% — nearly six times the 11% threshold — signals a genuine economic moat. Adobe generates $0.59 of after-tax operating profit for every dollar deployed in the business. This is the metric Warren Buffett and Charlie Munger have consistently used to identify durable competitive advantages.
The Three Scenarios: What Happens to Your Money Over 10 Years
Rather than offering a single price target — which implies a false precision no honest analyst can deliver — LIUV maps three distinct futures. Each scenario is grounded in Adobe’s current fundamentals and reflects a plausible range of business outcomes.
Starting point: Price $273 | EPS $16.70 | FCF/share ~$24 | Revenue $23.8B
AI Disruption Accelerates, Market Share Erodes
Assumption: AI creative tools (Midjourney, Canva AI, open-source models) increasingly commoditize Adobe’s core design market. Revenue growth decelerates sharply. Margins compress as Adobe invests heavily to defend its position.
| Metric | Year 1 | Year 5 | Year 10 |
|---|---|---|---|
| Revenue Growth (CAGR) | 3% | 3% | 3% |
| EPS ($ per share) | ~$17.54 | ~$21.30 | ~$27.20 |
| ROIC (%) | 45% | 35% | 30% |
| FCF Margin (%) | 38% | 34% | 32% |
| P/E Multiple | ~20x | ~17x | 15x |
| P/FCF Multiple | ~16x | ~13x | 12x |
| Implied Stock Price | ~$351 | ~$362 | ~$408 |
If you invest $10,000 at $273 today and the Low Scenario occurs:
Value after 10 years: ~$14,945
Total return: +49.5%
Annualized return: ~4.1% per year
Margin of Safety check: A low-cost index ETF has historically returned 8–10% annually. The Low Scenario produces approximately 4.1% — meaningfully below the ETF baseline. This scenario does not clear LIUV’s 12% margin of safety hurdle for individual stock ownership.
Steady State, AI Features Drive Re-acceleration
Assumption: Adobe successfully integrates AI across its Creative Cloud, Document Cloud, and Experience Cloud suites. Firefly adoption drives new user acquisition and upsells. Revenue re-accelerates modestly. Margins hold.
| Metric | Year 1 | Year 5 | Year 10 |
|---|---|---|---|
| Revenue Growth (CAGR) | 8% | 8% | 8% |
| EPS ($ per share) | ~$18.70 | ~$29.40 | ~$51.90 |
| ROIC (%) | 55% | 50% | 45% |
| FCF Margin (%) | 40% | 39% | 38% |
| P/E Multiple | ~19x | ~20x | 22x |
| P/FCF Multiple | ~16x | ~17x | 18x |
| Implied Stock Price | ~$355 | ~$588 | ~$1,142 |
If you invest $10,000 at $273 today and the Medium Scenario occurs:
Value after 10 years: ~$41,830
Total return: +318%
Annualized return: ~15.4% per year
Margin of Safety check: 15.4% annually clears LIUV’s 14% medium-scenario hurdle and substantially outperforms the 8–10% ETF baseline. This scenario justifies the concentration risk of owning Adobe over an index fund.
AI-Powered Creative Renaissance, Platform Expansion
Assumption: Adobe becomes the de facto platform layer for AI-assisted creative and enterprise workflows. Firefly and Document Intelligence drive significant new enterprise revenue. Pricing power strengthens. Margins expand.
| Metric | Year 1 | Year 5 | Year 10 |
|---|---|---|---|
| Revenue Growth (CAGR) | 13% | 13% | 13% |
| EPS ($ per share) | ~$19.70 | ~$37.10 | ~$87.40 |
| ROIC (%) | 60% | 58% | 55% |
| FCF Margin (%) | 43% | 44% | 44% |
| P/E Multiple | ~22x | ~26x | 30x |
| P/FCF Multiple | ~19x | ~22x | 25x |
| Implied Stock Price | ~$432 | ~$965 | ~$2,622 |
If you invest $10,000 at $273 today and the High Scenario occurs:
Value after 10 years: ~$96,044
Total return: +860%
Annualized return: ~25.4% per year
Margin of Safety check: 25.4% annually substantially clears LIUV’s 16% high-scenario hurdle. This would represent one of the strongest performing positions in any long-term portfolio.
Reading the Scenarios: What This Means for You
The three scenarios present a clear picture:
The key question for any investor in Adobe at $273 is: how much confidence do you have that the Low scenario does NOT occur?
If you assign a high probability to AI permanently disrupting Adobe’s creative market, the ETF alternative is the more rational choice — simpler, diversified, and historically returning 8–10% annually without the concentration risk.
If you assign a reasonable probability to the Medium or High scenario — which requires believing that Adobe’s ROIC of 58.8%, its 93% recurring revenue, and its AI integration position are durable — then the risk-reward at $273 becomes compelling relative to the ETF baseline.
This is how rigorous investors think. Not “is this a good company?” but “what do I need to believe about the future, and is that belief justified by the current evidence?”
LIUV’s 10-pillar framework is designed to build that evidence base — consistently, comprehensively, and without emotion. Process quality, sustained over time, produces better outcomes than emotionally-driven, inconsistent decision-making.
The Honest Caveat
These scenarios are analytical projections, not predictions. No model — AI-powered or otherwise — can forecast the future with certainty. Markets can remain irrational far longer than any framework anticipates. Business conditions change. Assumptions that look reasonable today may prove wrong.
What LIUV provides is a rigorous, disciplined process applied consistently. Process quality, sustained over time, produces better outcomes than emotionally-driven, inconsistent decision-making. That is the lesson of the SPIVA data, of decades of academic research, and of Buffett’s career.
The rest is up to you.
This article is for informational and educational purposes only. It does not constitute financial, investment, tax, or legal advice. All financial data sourced from public filings and third-party data providers. Scenario projections are hypothetical and illustrative only — actual outcomes may differ materially. Past performance does not guarantee future results. LIUV is MiFID II, SEC/Reg BI, SEBI, and CVM compliant. See liuv.io/compliance for full regulatory disclosures.